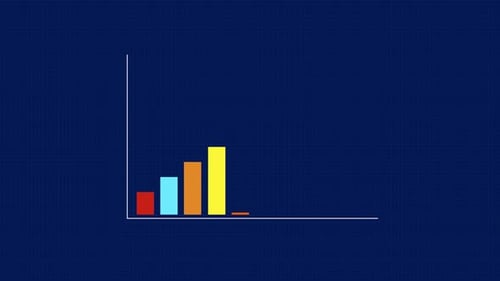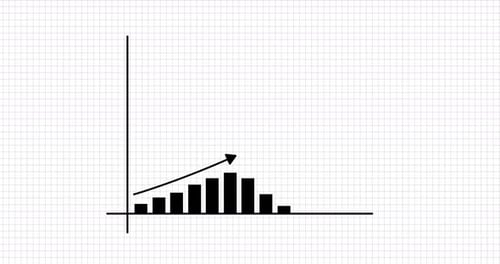
Animated Financial Growth Chart with Hand-Drawn Bar Graphs
By TaspiaahmmedOne great value subscription from €14.50/month
- Unlimited downloads of 27+ million creative assets
- AI Tools: video, image and more
- Lifetime commercial license
- Easy cancellation
Already have an account? Sign in
Attributes
- Length
- 0:15
- Resolution
- 1920 x 1080
- File Size
- 653 MB
- Frame Rate
- 30 fps
- Alpha Channel
- No
- Looped
- Yes
- Video Encoding
- ProRes
- Orientation
- Horizontal
- Commercial License
- Further Information
Description
This animated clip features a vibrant, hand-drawn interpretation of a financial growth chart. Multiple bar graphs in varying heights and colors, along with upward-trending arrows, illustrate positive market movement and data progression. The textured, slightly imperfect aesthetic gives the graphic a unique, artistic charm. This looping visual effect is ideal for enhancing business presentations, financial reports, or any project requiring a dynamic and engaging representation of statistical growth and success. It offers a creative alternative to standard data visualizations, adding a touch of personality and visual interest to corporate or educational content.