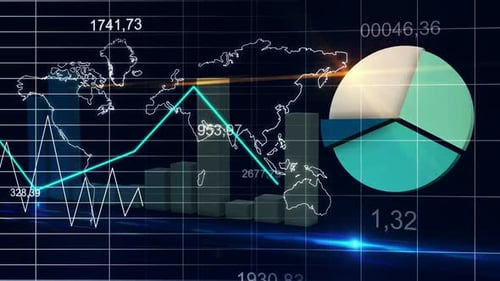
Animated Global Business Data with Digital Graphs and World Map
By TananchaiOne great value subscription from €14.50/month
- Unlimited downloads of 27+ million creative assets
- AI Tools: video, image and more
- Lifetime commercial license
- Easy cancellation
Already have an account? Sign in
Attributes
- Length
- 0:13
- Resolution
- 1920 x 1080
- File Size
- 799 MB
- Frame Rate
- 25 fps
- Alpha Channel
- No
- Looped
- No
- Video Encoding
- Photo JPEG
- Orientation
- Horizontal
- Commercial License
- Further Information
Description
This animated visual effect presents a dynamic digital representation of global data and financial statistics. Over a subtle, blurred world map, a wireframe globe slowly rotates at the center. Animated bar graphs rise and fall on either side of the globe, while three distinct line graphs (red, green, blue) fluctuate across the foreground, indicating trends. Various numerical data points appear and disappear, adding to the sense of real-time data analysis. The overall aesthetic is clean, futuristic, and technology-focused, utilizing a palette of deep blues and vibrant data lines. This visual can enhance corporate presentations, financial reports, technological showcases, or any project requiring a sophisticated depiction of global business intelligence and data visualization.