GRADIENT ROUND CHART
By GatamotionOne great value subscription from €14.50/month
- Unlimited downloads of 27+ million creative assets
- AI Tools: video, image and more
- Lifetime commercial license
- Easy cancellation
Already have an account? Sign in
Attributes
- Length
- 0:05
- Resolution
- Resizable
- File Size
- 238 MB
- Application Supported
- After Effects
- Required Plugin
- None required
- After Effects Version
- CC
- Commercial License
- Further Information
Description
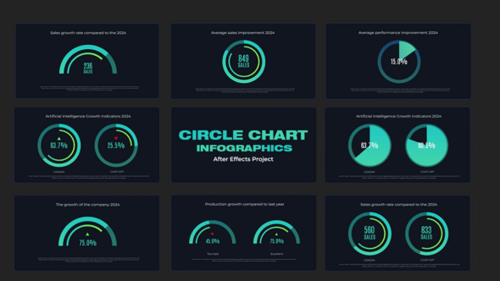
This infographic template features a versatile collection of animated round charts, including various radial, pie chart styles, and speedometer-like gauges. Each chart utilizes a vibrant gradient color palette and smooth, data-driven animations to effectively visualize percentages, statistics, and progress. Clear text placeholders allow for customizable labeling of data points, headings, and descriptions. This pack is an ideal solution for enhancing corporate presentations, business reports, educational content, or any project requiring dynamic and visually appealing data representation with a modern aesthetic. The modular design ensures easy customization of data values and colors to align with specific branding.
About this item
Perfect for these creative pros:
- Motion designers animating corporate data graphics in After Effects
- Video editors producing business explainers and report videos
- Marketing and communications teams presenting campaign or company results
- E-learning producers creating statistics-driven educational videos
Use cases for this item:
- Animated percentage and progress rings for a quarterly results video
- Speedometer-style KPI gauges in a product performance explainer
- Gradient pie chart breakdowns for an educational lesson on statistics
- Animated survey result charts for a corporate presentation or annual report video