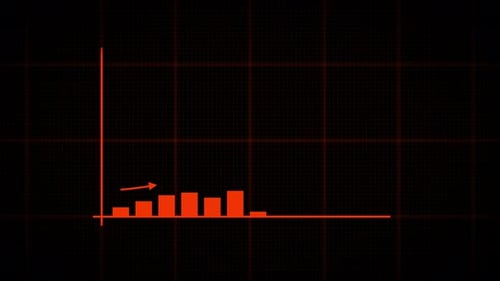
Animated Red Line Graph with Glowing Data Points
By root8815One great value subscription from €14.50/month
- Unlimited downloads of 27+ million creative assets
- AI Tools: video, image and more
- Lifetime commercial license
- Easy cancellation
Already have an account? Sign in
Attributes
- Length
- 0:12
- Resolution
- 3840 x 2160
- File Size
- 1.4 MB
- Frame Rate
- 29.97 fps
- Alpha Channel
- No
- Looped
- No
- Video Encoding
- H.264
- Orientation
- Horizontal
- Commercial License
- Further Information
Description
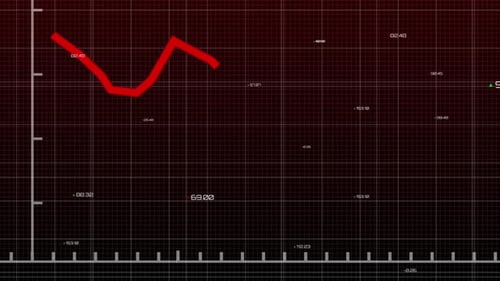
This animated visual features a vibrant red line graph dynamically charting progress across a dark, grid-patterned background. The line connects several glowing circular data points, which subtly pulsate, drawing attention to key values and changes in the trend. The aesthetic is modern and digital, with clean geometric shapes and a sharp contrast that emphasizes the data's movement. A subtle digital grid provides a high-tech backdrop, reinforcing the analytical theme. Ideal for business presentations, financial reports, technological explainers, or scientific visualizations, this animation effectively communicates growth, fluctuations, and statistical insights. It serves as an engaging overlay or background element to enhance corporate videos, infographics, and data-driven content, making complex information visually compelling and easy to follow.